geometrix - Fotolia
Using Oracle ADDM reports to resolve SQL performance problems: Step-by step guide
Using Oracle ADDM is an effective way to resolve SQL performance problems, according to Brian Peasland. ADDM is his go-to tool for finding problem SQL statements.
Oracle's Automatic Database Diagnostic Monitor (ADDM) examines database bottlenecks and recommendations for fixing them.
Out of the box, the Automatic Workload Repository (AWR) takes a snapshot of database metrics once per hour. The difference between two snapshots tells a lot about what a database is doing.
After ADDM takes a snapshot, it looks at performance over the past hour and automatically generates a report of its findings.
I interact with ADDM reports via Enterprise Manager 12c by finding my database and then selecting Advisor Central from the Performance menu. In the Results section, I can see all the ADDM runs (Figure 1).
Recently, I got a call about a batch job that did not complete in a timely fashion. I knew the job was running somewhere between 5:00 and 6:00 in the morning. I found the report that correlated with a 5:00 a.m. start time and selected it.

Unfortunately, I rarely find the next screen to be of much help.
Instead, I click on the View Report button. I can see from the top of the report (Figure 2) that these findings are indeed from the time period I need. ADDM then gives me a quick summary of its findings (Figure 3).


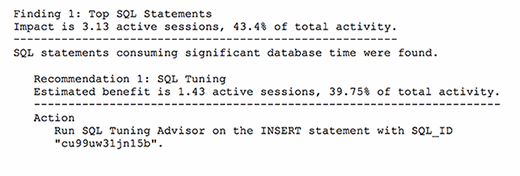
By looking at the findings, I see that there are five recommendations about problematic SQL statements. The report indicates that the top SQL statements are responsible for 43.4% of total database activity (Figure 4). Of that 43.4%, the first SQL statement accounts for 39.75%. Clearly, I know the singular SQL statement that is contributing to the database performance bottleneck.

The Action provided to me by the ADDM is to use the SQL Tuning Advisor, but I can use other methods, too. It is important to note that ADDM recommendations and rationale need to be weighed carefully. Figure 5 shows the rationale from one ADDM finding.

ADDM thinks this SQL statement is a problem because it had a total runtime of 438 seconds. However, each execution was less than two-tenths of a second. This query is performing fine and the application does need to execute it that many times per hour. The lesson is that not all ADDM findings are action items for the DBA.
If you're using SQL Developer, you can access ADDM findings without leaving the application. Simply go to View > DBA and add a database connection. In that connection, go to Performance > ADDM to see the runs. Click on a run and you can promptly see the Findings and ADDM Report.
I also like to use EM12c's Real Time ADDM when someone calls to complain that "the database is slow." I don't want to wait for the ADDM report at the top of the hour. Instead, I select Real Time ADDM under the Performance menu of my database. I then click on the Start button. Real Time ADDM goes to work and when finished, presents me with its findings (Figure 6).

I can then click on the Findings tab to obtain more information. I'm now off and running with ADDM again.
There is a danger for some DBAs to comb through ADDM reports trying to spot a problem, even when they don't know a problem exists; in other words, they exhibit Compulsive Tuning Disorder. I rarely look at ADDM reports automatically generated by Oracle. Instead, I look at them only when I know I have a problem at a specific point in time, or I use Real Time ADDM. Rather than deciphering a long AWR report, ADDM findings can save me a lot of time.


